

Create a diagram in WordPress: draw flowcharts, charts and diagrams
You want to create a diagram directly in WordPress, without switching between an external diagram program, downloads and the media library? With neo Draw you draw flowcharts, process diagrams, simple org charts, mind maps, charts and technical diagrams right where you edit your post.
The editor is based on Excalidraw and saves the result as an SVG in the WordPress media library. Shapes, arrows, texts and images remain editable. You can reopen the diagram later, change a process step or adjust the colors to match your website design.
Create a diagram in WordPress: the quick guide
- Download neo Draw from the product page and activate it in WordPress.
- Open a new drawing in the media library, in Gutenberg, Bricks, Elementor or in the Classic Editor.
- Create shapes, label them and connect them with arrows or lines.
- Add colors, icons, images and, if needed, clickable links.
- Save the finished diagram as an SVG in the WordPress media library and insert it into the page.
You don’t need any additional desktop software for a simple process diagram. If you want to see the editor first, the sandbox opens a prepared WordPress environment in the browser.
Which diagrams can you create with neo Draw?
neo Draw is a free drawing editor. You’re not limited to a fixed diagram template. Rectangles, diamonds, circles, arrows, lines, text, images and freehand drawings can be combined. With these you can build, for example:
- Flowcharts and process diagrams for workflows, approvals or instructions
- Diagrams and infographics for blog posts and landing pages
- Simple org charts, mind maps and decision trees
- UML-like sketches, technical diagrams and system overviews
- Bar or line charts from two-column tables and CSV data
- Annotated screenshots, maps and images with clickable areas
Mind maps, org charts and UML are use cases of the drawing editor. neo Draw does not generate these models automatically according to a formal standard. You place the required shapes and relationships yourself or use an existing graphic as a starting point.

Create a flowchart and process diagram
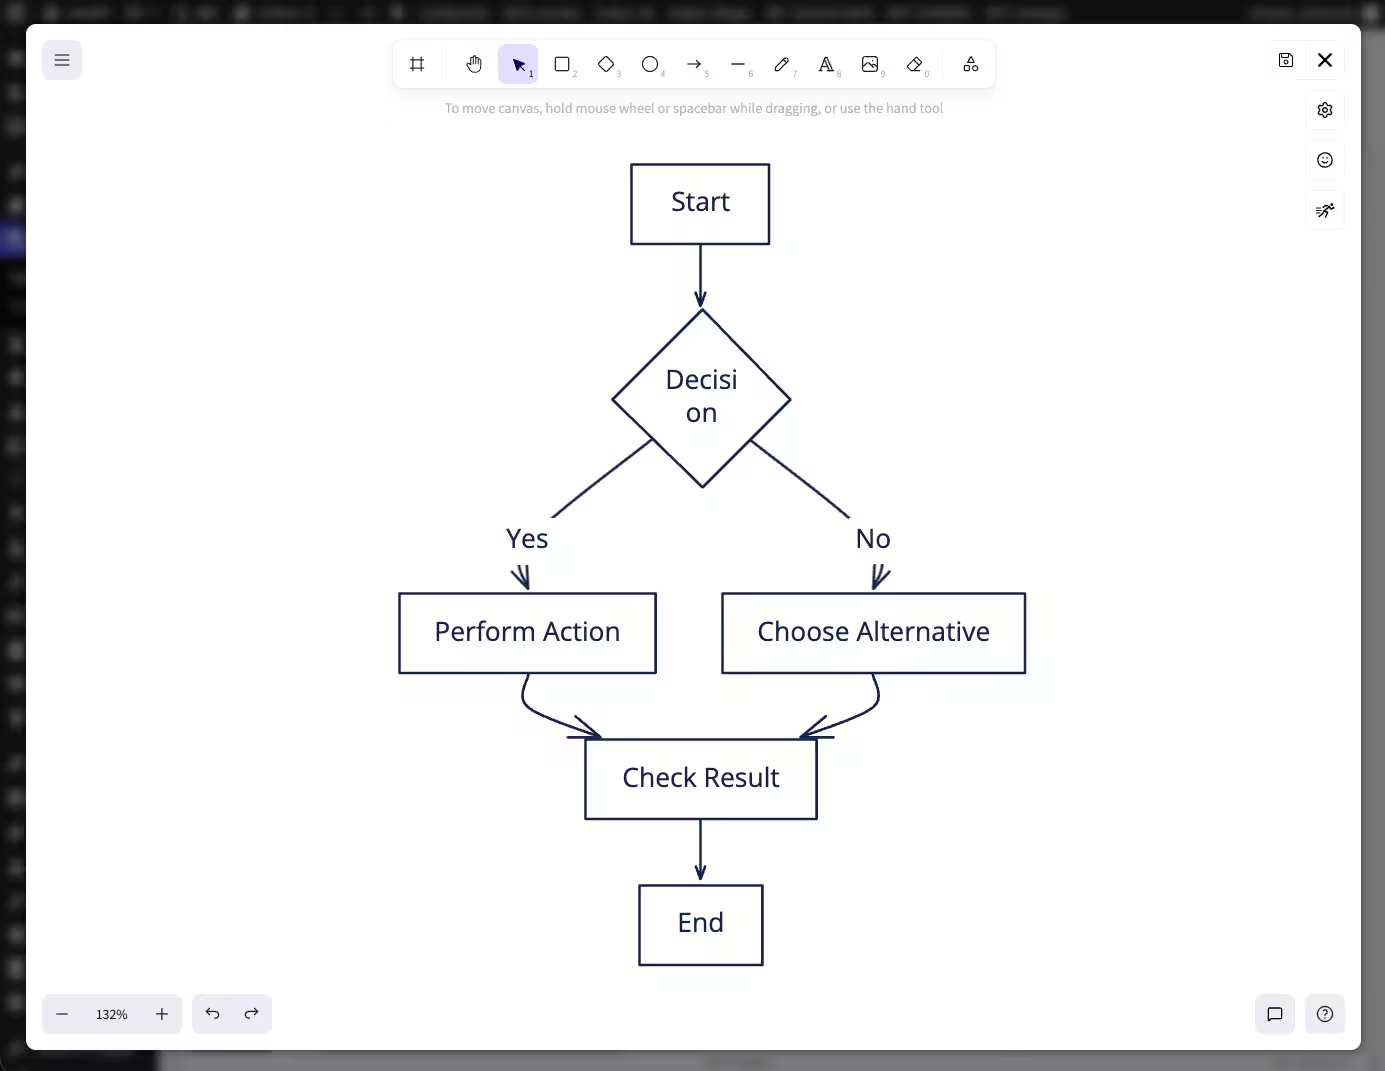
For a flowchart start with the main steps. A rectangle usually stands for a task, a diamond for a decision. Then connect the elements with arrows. The arrows stay attached to the shapes when you move a node later.
First write only short labels inside the shapes. Detailed explanations belong in the text next to the diagram. That keeps the flow readable on a smartphone and makes later changes easier.
Draw mindmap, org chart and UML diagram
A mindmap grows from a central term and connected subtopics. For an org chart you arrange roles or teams hierarchically. Technical readers can sketch classes, components, states or data flows with the same tools.
If you need a standards-compliant UML or BPMN model, a specialized modeling program is the better source. For an understandable graphic in a WordPress article the freely designed representation is often enough because you can adapt labels, color and layout precisely to the content.
How to create a diagram with neo Draw
1. Install neo Draw and open it in WordPress
Open the neoDraw product page, download the plugin and install the ZIP under Plugins > Add Plugin > Upload Plugin. After activation you can start a drawing via the neoDraw action link, the WordPress media library or a supported image element.
In Gutenberg, Bricks, Elementor and the Classic Editor the entry sits directly in the respective image workflow. You can therefore write the article first and create the diagram exactly where it should appear later.

2. Choose diagram type and reading direction
Decide before drawing what the graphic should explain. A process usually runs left to right or top to bottom. An org chart needs a clear hierarchy. In a mindmap the main topic is in the center.
List the nodes first as a short list. For an approval flowchart these could be "Draft", "Review", "Changes needed?" and "Publish." This small preparation prevents you from constantly inserting new boxes between existing connections while designing.
3. Draw shapes, arrows and text
Choose a rectangle, diamond or circle and draw the first shape. Double-click to label it. Use the arrow tool to connect the shapes. You can then adjust lines, arrowheads, stroke, fill, opacity and sketch style.
You can select multiple elements, group, align and move them together. For technical diagrams a calm base system pays off: one color for normal steps, a second for decisions and a striking color for the main path.
4. Add icons, images and links
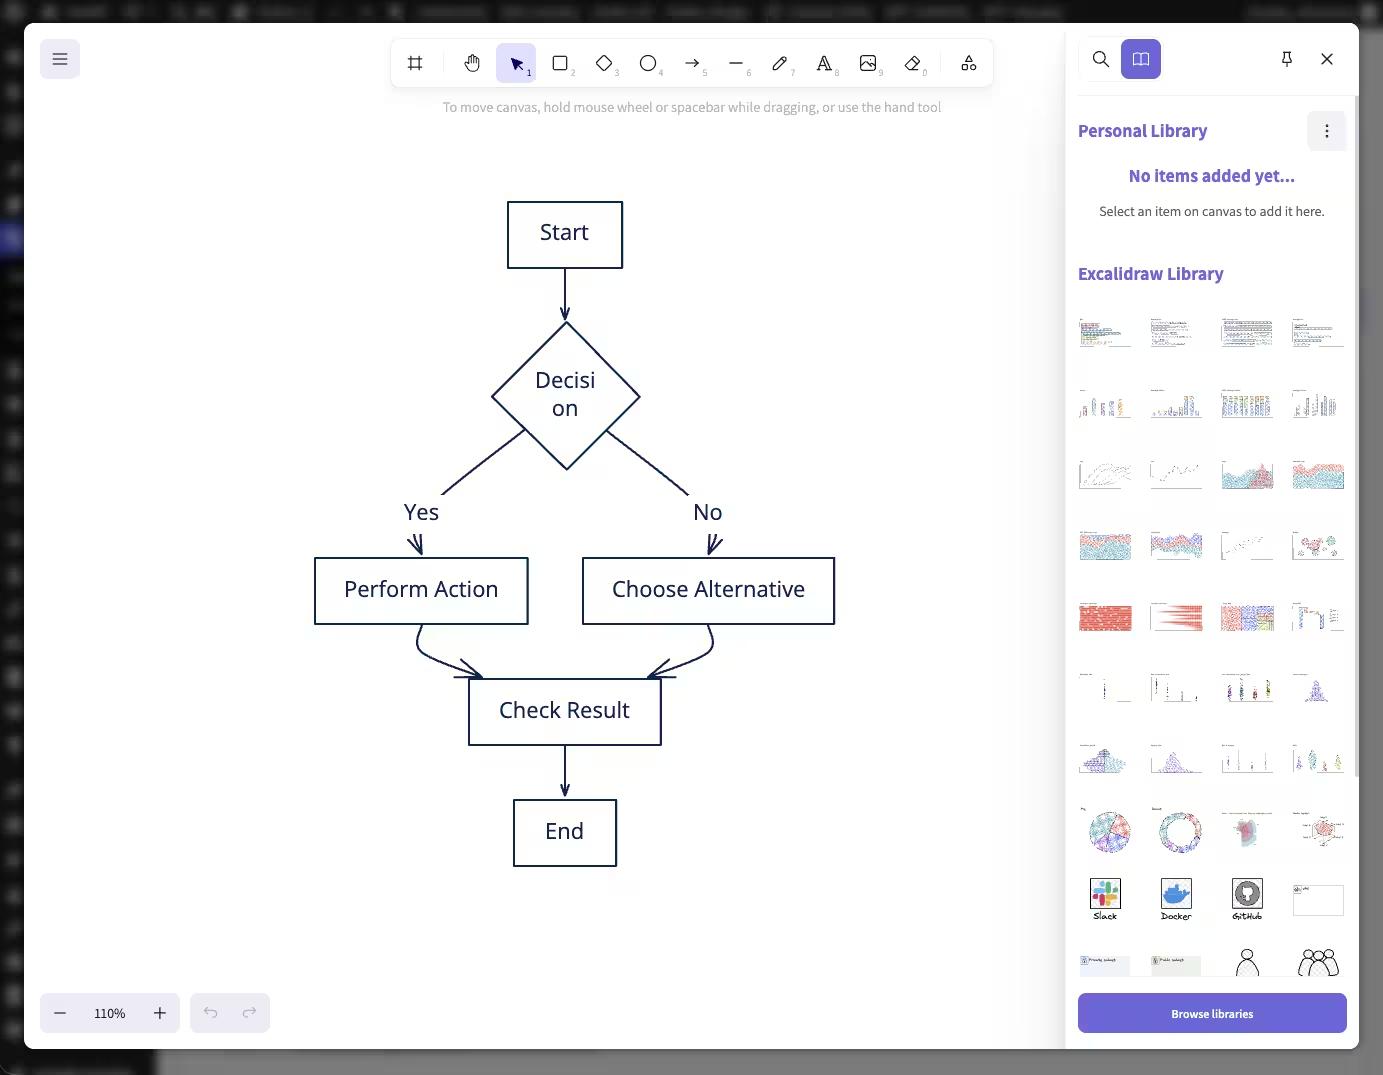
The icon library adds symbols and emojis so you do not have to draw every small graphic yourself. Your own images can also be placed on the canvas and labeled. This is useful for product flows, maps, support graphics and step-by-step guides.
Elements can have a link. On the website a linked neoDraw image is exported as a real SVG so clickable areas work. Use links sparingly and make clear in the surrounding text where they lead.

5. Save the diagram as SVG and insert it
Save the finished drawing in neo Draw. WordPress receives a normal attachment in the SVG format. Width, height and modification date are stored in the media metadata so page builders and the media library can work with the graphic like an image.
The editor data remains embedded in the file. If you open the diagram again later, you can continue editing shapes, connections and labels. An export as PNG or SVG is also possible if you want to use the graphic outside the website.


Create a diagram from CSV or table
If your data is in two columns you can copy it from a table or paste it as CSV or TSV. neo Draw recognizes an optional header as well as labels and numeric values. From this a bar or line chart is created whose elements can be further edited on the canvas.
This works for small comparisons, survey values or a short time series in a blog post. For large datasets, statistical analyses or continuously updated dashboards you should check the data first in a spreadsheet or a specialized chart tool.

Directly in Gutenberg, Bricks, Elementor and the Media Library
neo Draw provides direct entry points into Gutenberg, Bricks, Elementor, the Classic Editor and the WordPress media library. In list and grid view you can reopen existing neoDraw files. The attachment edit page and the WordPress media selection dialog are also integrated.
Other page builders can use the saved SVG via the normal WordPress media library. The drawing is therefore not tied to the editor in which you created it. A diagram created in Gutenberg can later be used in Bricks and edited again via the media library.

Why SVG makes sense for a WordPress diagram
An SVG consists of vector shapes. Lines and text therefore remain sharp on high-resolution displays and at different image sizes. This is helpful for diagrams because thin arrows and small labels in a compressed raster image quickly look messy.
neo Draw saves the drawing as an image file in the media library. The graphic remains visible on the website even if you later deactivate the plugin. For clickable or animated content the SVG is additionally output in the frontend as a real SVG structure.
Prepare diagrams for SEO and accessibility
Google can interpret the surrounding text better than a complex graphic alone. Therefore also explain the main process in the article. Give the attachment a specific filename, title and alt text, for example flowchart-wordpress-approval-process.svg and Flowchart from draft through review to publication. If you maintain these details for many media files you can use neo Rename to rename image files directly in WordPress and use neo Alt to find and add missing alt texts.
An alt text should convey the core message, not transcribe every node. For an extensive organizational chart or UML diagram the visible article needs a more detailed text alternative. Also check the font size on the smartphone. A sharp SVG can still be unreadable if too much content is crammed into a small area.
Prepare a diagram with AI and design it in neo Draw
An AI can help you break a process into short steps or suggest suitable nodes for a flowchart. Then copy the reviewed structure into neo Draw and style it visually. neo Draw itself is the drawing editor, not the automatic AI diagram generator.
Ask a language model for example to get a list of process steps, decisions and connections. Verify technical statements and order before you build the graphic from them. This keeps content control with you and the drawing still matches the design of your WordPress site.
Brief comparison with other diagram tools
Excel and Google Sheets are practical for charts from numbers. Canva is suitable for designed infographics. diagrams.net is geared toward technical flowcharts and extensive shape libraries. Word and PowerPoint suffice for a quick graphic in a document.
neo Draw fits when the diagram is created directly in WordPress, stored as an SVG in the media library and later edited in the same workflow. For formal modeling, very large datasets or collaborative real-time editing, a specialized external tool may be more suitable.
Frequently asked questions about creating diagrams in WordPress
Can I create a diagram directly in WordPress?
Yes. With neo Draw you open the drawing editor from the WordPress media library or from supported editors and then save the diagram as an SVG attachment.
What types of diagrams can I draw with neo Draw?
With shapes, arrows, lines, text and images you can create flowcharts, process diagrams, charts, simple mind maps, org charts, technical sketches as well as bar and line charts.
Can neo Draw create a diagram from CSV data?
Yes. Two-column table CSV or TSV data with an optional header can be inserted as a bar or line chart and then edited on the canvas.
Can I edit a neo Draw diagram later?
Yes. The editor data remain embedded in the SVG file. You can reopen the drawing and change shapes, text, colors or connections.
Does neo Draw work with Gutenberg Elementor and Bricks?
Yes. neo Draw has direct integrations for Gutenberg, Elementor, Bricks and the Classic Editor. Saved SVG files can also be used via the WordPress media library.
Can I export the diagram as SVG or PNG?
Yes. neoDraw drawings can be exported as SVG or PNG. In WordPress the plugin stores the editable drawing as an SVG in the media library.
Does the diagram remain visible after deactivation?
Yes. The saved SVG is a normal image file in the WordPress media library and remains usable on the site.
Can I link areas in the diagram?
Yes. Shapes and text can have links. neo Draw outputs linked drawings in the frontend as clickable SVG.
Create the diagram where you publish it
For a WordPress article the shortest route is often best: open neo Draw, draw the main nodes, set connections and save the SVG directly to the media library. You do not need to download a file from an online diagram tool and reupload it later.
Start with a small flow of four or five steps. Check it on your smartphone and only then add icons, colors or links. If the process changes, reopen the same drawing and adjust the affected node.

